Objetivo: Realizar a mudança de gráficos em dashboard a partir de botões selecionados. Dashboard Excel – Mudar gráficos por botões
Esta planilha demonstra a utilização da gravação de macros em VBA, mescladas com algumas alterações realizadas no código fonte para que os gráficos sejam configurados adequadamente a cada caso.
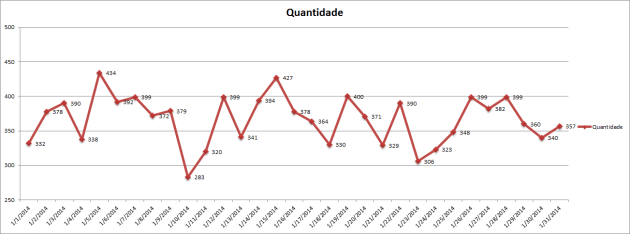
Ao clicar no botão Diário Qtde:
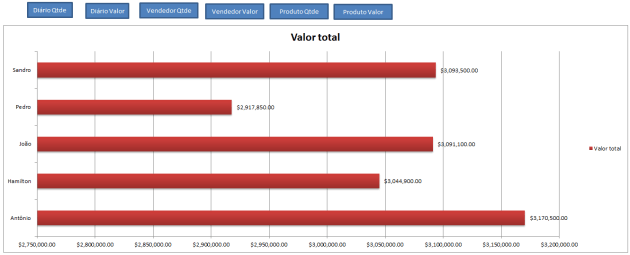
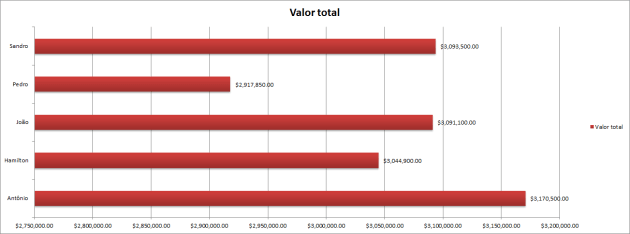
Botão Vendedor Valor:
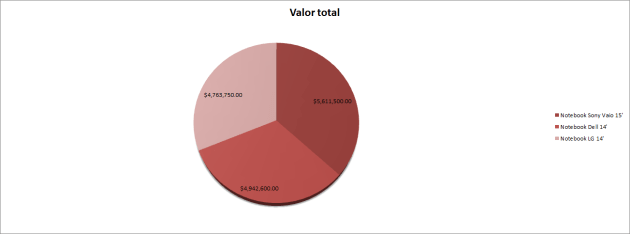
Botão Produto Valor:
Abaixo o código fonte utilizado para a construção da aplicação:
Sub Grafico_Linha_Quantidade()
    ActiveSheet.ChartObjects("Chart 1").Activate
    ActiveChart.SeriesCollection(1).ApplyDataLabels
    ActiveChart.SeriesCollection(1).DataLabels.Select
    ActiveChart.ChartType = xlLineMarkers
    ActiveChart.SetSourceData Source:=Range("Sumário!$A$2:$B$33")
    ActiveChart.Axes(xlValue).Select
    ActiveChart.Axes(xlValue).MinimumScale = 0
    ActiveChart.Axes(xlValue).MinimumScale = 250
    ActiveChart.Axes(xlValue).MaximumScale = 500
End Sub

Sub Grafico_Linha_Valor()
    ActiveSheet.ChartObjects("Chart 1").Activate
    ActiveChart.SeriesCollection(1).ApplyDataLabels
    ActiveChart.SeriesCollection(1).DataLabels.Select
    Selection.Delete
    ActiveChart.ChartType = xlLineMarkers
    ActiveChart.SetSourceData Source:=Sheets("Sumário").Range("A2:A33,C2:C33")
    ActiveSheet.ChartObjects("Chart 1").Activate
    ActiveChart.Axes(xlValue).Select
    ActiveChart.Axes(xlValue).MinimumScaleIsAuto = True
    ActiveChart.Axes(xlValue).MaximumScaleIsAuto = True
    ActiveChart.Axes(xlValue).MinimumScale = 250
    ActiveChart.Axes(xlValue).MinimumScale = 300000
    ActiveChart.Axes(xlValue).MinimumScale = 350000
End Sub
Sub Grafico_Vendedor_Qtde()
    ActiveSheet.ChartObjects("Chart 1").Activate
    ActiveChart.ChartType = xlBarClustered
    ActiveChart.SetSourceData Source:=Sheets("Sumário").Range("E2:F7")
    ActiveChart.Axes(xlValue).Select
    ActiveChart.Axes(xlValue).MinimumScaleIsAuto = True
    ActiveChart.SeriesCollection(1).Select
    ActiveChart.SeriesCollection(1).ApplyDataLabels
End Sub

Sub Grafico_Vendedor_Valor()
    ActiveSheet.ChartObjects("Chart 1").Activate
    ActiveChart.ChartType = xlBarClustered
    ActiveChart.SetSourceData Source:=Sheets("Sumário").Range("E2:E7")
    ActiveChart.SetSourceData Source:=Sheets("Sumário").Range("E2:E7,G2:G7")
    ActiveChart.Axes(xlValue).Select
    ActiveChart.Axes(xlValue).MinimumScaleIsAuto = True
    ActiveChart.SeriesCollection(1).Select
    ActiveChart.SeriesCollection(1).ApplyDataLabels
End Sub
Sub Grafico_Produto_Qtde()
    ActiveSheet.ChartObjects("Chart 1").Activate
    ActiveChart.SetSourceData Source:=Sheets("Sumário").Range("I2:J5")
    ActiveChart.ChartType = xl3DPie
    ActiveChart.SetElement (msoElementLegendRight)
End Sub
Sub Grafico_Produto_Valor()
    Range("O2").Select
    ActiveSheet.ChartObjects("Chart 1").Activate
    ActiveChart.SetSourceData Source:=Sheets("Sumário").Range("I2:I5")
    ActiveChart.SetSourceData Source:=Sheets("Sumário").Range("I2:I5,K2:K5")
    ActiveChart.ChartType = xl3DPie
End Sub
DIGITE O SEU EMAIL PARA FAZER O DOWNLOAD DOS ARQUIVOS: Baixe a planilha
Abraço
Marcos Rieper


